Back in August, I released the Saving Ninja Super Spreadsheet , that’s the spreadsheet that I use each month in my savings reports . There’s also another spreadsheet that I use at least once a year to set myself a budget. I use this spreadsheet to figure out how much I can afford to invest each month.
I’ve been working on the Saving Ninja Budget Spreadsheet for quite a while, I didn’t want to release it until it was finished.
I use this spreadsheet to distinguish how much I’d like to spend on luxury items, holidays etc each year in order to still obtain a savings rate that I am happy with. This is why I’ve included savings percentage calculations within the spreadsheet.
For the couples out there, I’ve also added two sheets so you can fill in your budget for two people. The ‘Budget’ sheet will then add them both up for you.
So without further ado, the Saving Ninja Budget Spreadsheet.
The first thing you’ll notice on the ‘Person1’ or ‘Person2’ (feel free to change the top titles to your own names, but don’t change the sheet names or it will mess up the formulas!) sheet is the greyed out top section. This is all automatically generated and will show your total income, expenses and net money (income - expenses). The last section is your projected end balance at the end of that month, so you can check if you’re on track month by month.
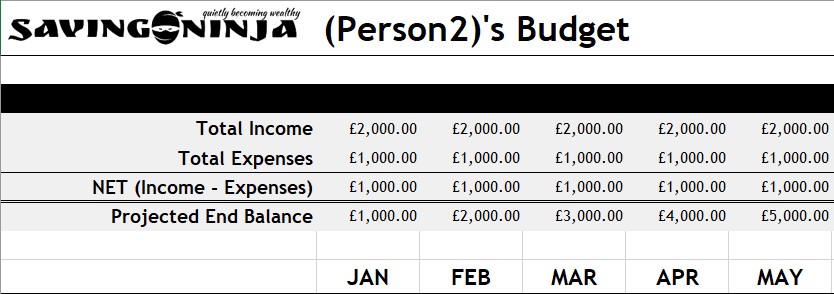
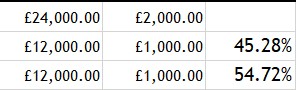
The spreadsheet will use these figures to calculate your average monthly spend and your year-end figures.
Your year-end figures will be used to calculate your savings rate at the end of the rows.
The greyed out area will get these figures from two sections below. The first section is for your income. You simply fill in your net take home pay per month in the wages section and any other income below that.
Note: Only add what you’re actually getting deposited into your bank each month. Do not put your pension deposits in here, there’s a separate section for pensions that we’ll get to later.
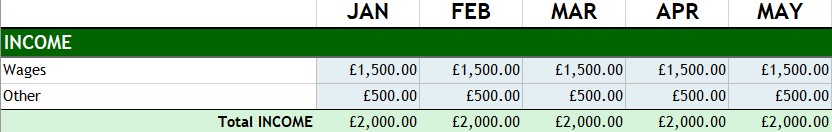
Fill in each month’s predicted income, remember this is your yearly (predicted) budget, not your actual income
The second, larger, section is for your expenses. This can be quite tricky to fill in if you haven’t done this before. But, fill it into the best of your knowledge to start off with, then you can update it throughout the year as your bills come in.
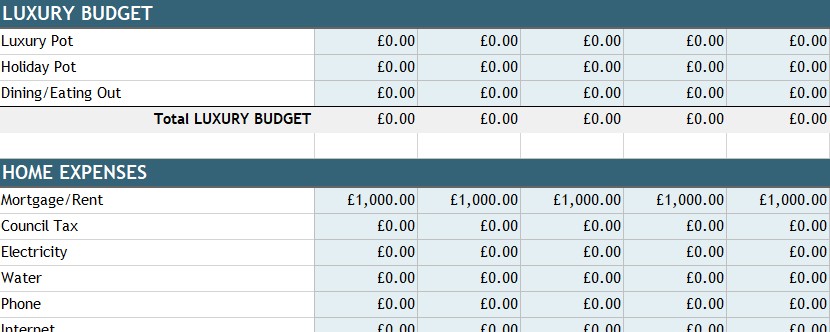
The luxury pot section is for anything that you deem to be not necessary, a ‘fun budget’ if you will. I use this for buying new clothes, going out, etc
Most expenses should be covered, if not there is an ‘others’ row in each section. If you choose to add your own rows, be aware that this will probably mess up the formulas and analytics, so be sure to only do this if you’re a competent Excel user.
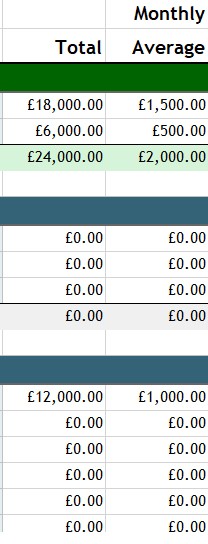
Each expense category’s total for the year will be displayed at the end of the row. It will also calculate your monthly averages. These cells will be what’s used in the top calculations.
It’s quite interesting to look at how much you spend in a year for each expense. You might be pretty shocked at some of the results!
My partner was surprised to find out her yearly vehicle cost was £1460!
We also spend £2,400 combined on food, and we thought we were good at cheap shopping! I’m cringing to think what the majority of UK households spend on food and eating out.
After filling in your income and expenses, it’s now time for the fun bit! Scroll along a little to the right and you’ll see this box.
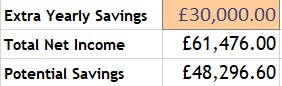
The ‘Extra Yearly Savings’ box is for things like your pension or any other expected investments. I was getting annoyed at my savings rate being displayed as too low due to depositing so much into my pension via salary sacrifice. So, this box is for things like your sacrificed pension savings.
So, if your net pay is £1000 per month, you’d put that in the income section. But, if your contributing £500 into your pension each month before you get paid, and if your employer is also adding in £500 per month, that’s an extra yearly savings of £12,000. Pop that right into this box and it will directly increase your savings rate percentage to a more accurate figure. Hurrah!
This box is also nice to have a play around with. For example, if you might get a £10,000 yearly bonus - pop that into this box and see what your savings rate could be.
If you’re filling in this budget for two people, just switch sheets at the bottom of the page. The ‘Budget’ sheet will add up the figures of both people and show a combined result. Awesome!
Next up is the the recreation of the ‘Calculate years to FI’ macro.
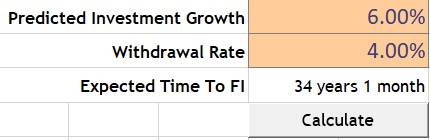
This bit won’t work via Google Sheets, you’ll have to download the xlms (macro enabled) worksheet.
This works in a similar way to the years to FI button on the savings spreadsheet with the difference of it being able to input a custom withdrawal rate. I’ll probably also add this to the savings spreadsheet on the next release.
The code will loop around each month simulating savings and investment growth based on your expenses and income. It will also take into account the ‘Extra Yearly Savings’ option. After you’ve reached your safe withdrawal rate adjusted stash, it will spit out how many years and months it took.
Analytics
You know, I was actually planning on finishing this article 2 days ago. But I spent _two days _working on this next section. That’s not just two evenings either, I’m currently off work as I had some holidays I needed to use up. I spent about 15 hours on this bloody bit!
Buut, it means we’ve now got some pretty charts to analyse our data, yipee!
The VB code was soo much easier to write than this!
Worth it eh?
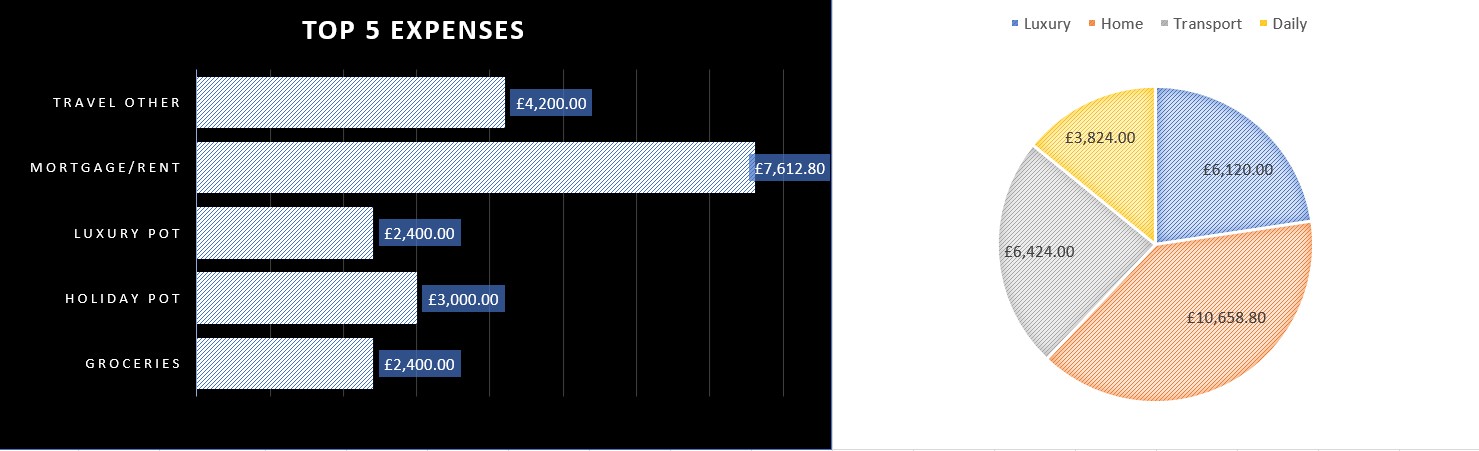
This first section will show you your top 5 expenses along with a pie chart of your expense categories.
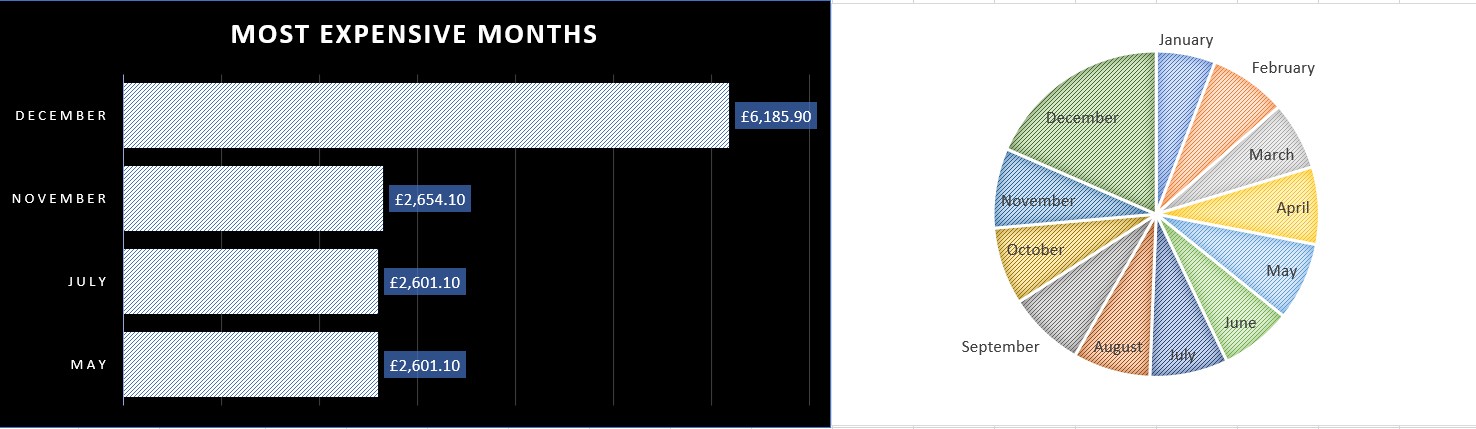
This next bit of snazzy chart goodness will show you your most expensive months along with all of your total month spend split into a pie chart.
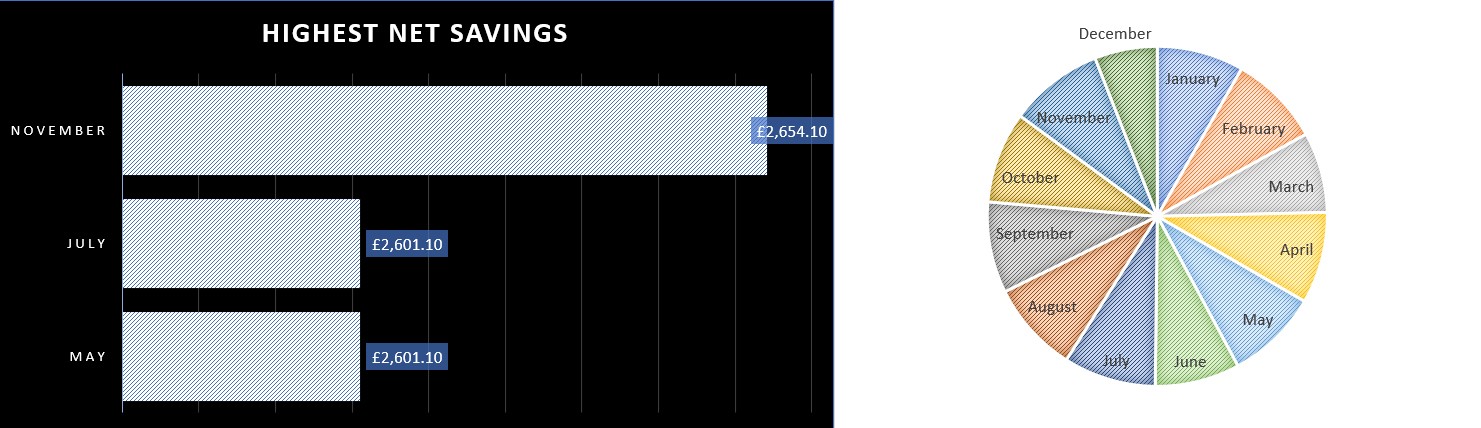
By this point, I was starting to run out of ideas for what I could make into a chart. But, not wanting my newly found skill to go to waste, I made these net savings charts! (let me know in the comments if you can think of more data to chartify)
Note: The tables won’t refresh automatically. You’ll have to close and re-open the spreadsheet for them to refresh.
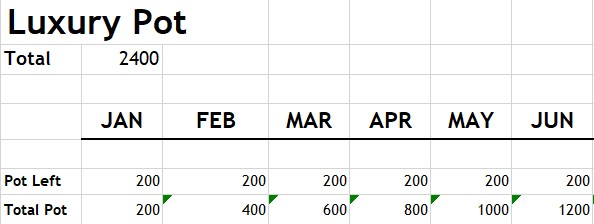
Luxury Pot
This brings us to the last section (which is in the ‘Budget’ sheet only), the Luxury Pot tracking. Now, this is just experimental so expect this to change.
After setting up my budget each year, there were some big ticket items that I wanted to buy but always felt guilty about buying. This section is my answer to saving up for these items so I don’t feel bad!
The idea is that you’ll set yourself a monthly ’luxury’ figure that you’re OK with spending. Say, £200 per month.
You’ll then edit the ‘pot left’ amount at the end of each month to see how much of your luxury pot you spent. Your total pot left will then stack each month and be represented in the bottom row.
Now, if you want to buy anything that you really shouldn’t be buying, like a Dyson cordless for example (they’re waay too expensive, but I want one!). You’ll just have to not spend anything for a couple of months until you can ‘afford it’ and have enough in your luxury pot.
Doing this is basically a way of grounding your rich ass and setting spending limits. It’s hard to do that without being a cheap ass and never buying anything you deem as ’too expensive’.
Now whenever someone says ‘wow, you spent £499 on a [Garmin Fenix 5](http://Garmin Fenix 5 GPS, Slate Grey with Black Band), you must be loaded.’ You can say, ’no, I saved up for this for 3 months thank you very much.’
The editable copy of this spreadsheet (along with lots of other content) is available on the Secret Ninja Page which all Saving Ninja subscribers have access to. Subscribers will also get an email update whenever new features have been added. If you’re not yet a subscriber; subscribe below. It’s free, and you can always unsubscribe if you don’t want to keep in touch.
I’ll be using this page as a landing page for any special requests or questions regarding this spreadsheet. If you have any feedback or even if you’ve found it helpful, please do leave a comment below; I’d love to hear from you!