Update: With the Saving Ninja Super Spreadsheet being over one and a half years old, it was about time it got modernised and bought into the fully online world of Google Sheets and away from Microsoft Excel.
Reminder: To download the sheet for your own use, Subscribe, and the download link will be emailed to you!
As of December 2019, all functionality can be used on Google Sheets, this includes the ‘Years to FI’, ‘Drawdown’ and ‘Compound’ calculators. There is no longer any need to install Microsoft Excel and download the files, although there are still Excel versions available on the Ninja page which all of my subscribers have access to.
The below article has been updated to include screenshots and instructions for use of the new Saving Ninja Super Spreadsheet online version.
I track my savings with the most powerful software in the world!!… Microsoft Excel Google Sheets!
Excel can do a whole lot more than most people think it can. As well as being an awesome data entry tool, you can enhance your sheet to the point of it being a fully-featured form. You can even add Python and Visual Basic code to run complicated macros that calculate anything you want.
The beauty of Excel really shines when you have a lot of data, you can do tons with it! Animated pie charts, interactive graphs, anything! This is why it really shocks me when people use or even pay for external software to track their expenses and savings. With Excel, it’s fully customizable, so you really can get a tailored product. It’s pretty damn easy to do too… Sure you might spend a little bit of time Googling how to structure a certain formula, but you’ll get it in no time.
I made a mega Excel sheet especially for Saving Ninja readers. I wanted it to be as simple as possible to track your monthly savings, but also provide the most useful stats possible. I even went the extra mile and added some Visual Basic code to calculate the expected time in which you’ll reach financial independence.
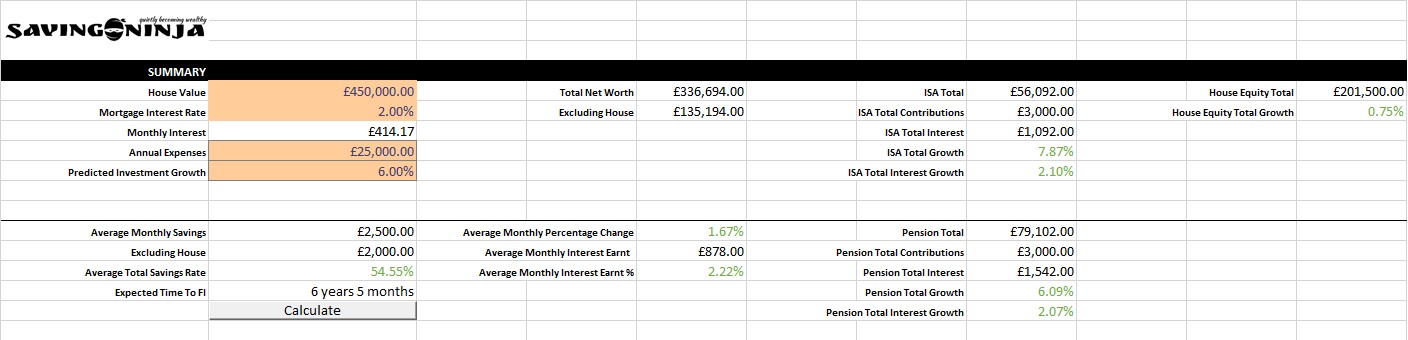
The document assumes that you have a budget and you know what your annual expenses are expected to be. I have a separate Excel document (and now Google Sheets as well) to calculate my budget, find that here .
It also assumes that you know your house value (if you own a house) and your mortgage interest rate. I wanted to track my savings as effortlessly as possible, so I added formulas that use your mortgage interest rate to automatically calculate how much house equity you have paid off every month.
The predicted investment growth is used to calculate your ‘Expected Time To FI’. This updates when you click the ‘calculate’ button. The Visual Basic code (or Google App Scripts code) which runs when you click this button recursively simulates future months based on your average savings rate.
It adds your predicted investment growth to your investment pots and also adds your house equity. The recursion stops when you’ve successfully got enough savings to retire on (using the 4% rule).
This section of the Excel document also shows lots of useful information based on your savings so far such as total pot worth, total growth and total interest earnt (in the current year).
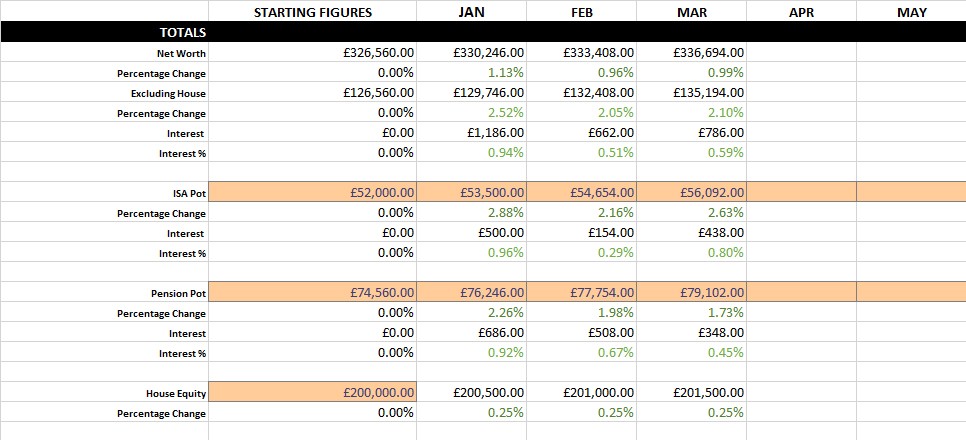
The next section of the document is where you’ll be updating your total pots each month. It will then use these figures to calculate how much interest you’ve earned and how much your pots have grown (or decreased). All of the orange boxes are user inputs; the rest is automatic. As you can see, the house equity (other than the starting figure) is calculated automatically based on your monthly contribution.
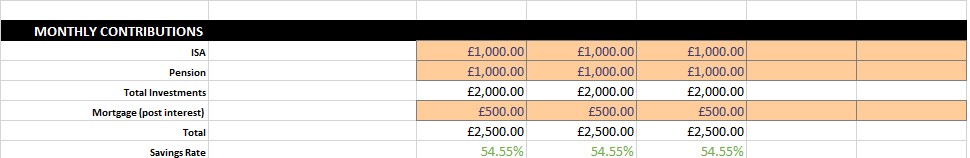
Finally, you’re monthly contribution section. Here you’ll enter how much you’ve contributed each month. It will use these figures to calculate your savings rate and figure out how much interest you’ve earned since the previous month.
New Additions
Draw Down Calculator
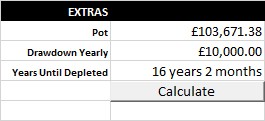
A lot of people will be trying to calculate how much money they need in their ISA to last them until they reach their pension pot. For this, I built the Drawdown Calculator. This is detached from all of the other data on the Spreadsheet (other than expected annual return). You simply add your Pot and your yearly drawdown and hit ‘Calculate’.
It then iterates month by month, drawing down and adding interest until you finally run out of money. It will let you know how long it lasted in the ‘Years Until Depleted’ cell.
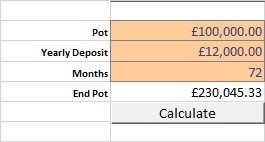
Compound Interest Calculator
Calculate all of your compound interest until your heart’s content! Input your pot, yearly deposits and months of compounding and hit the calculate button.
Analytics
The Analytics tab will predict your future growth based off the data that it has gathered for the year. This is split into 4 charts:
1. Total Net Worth
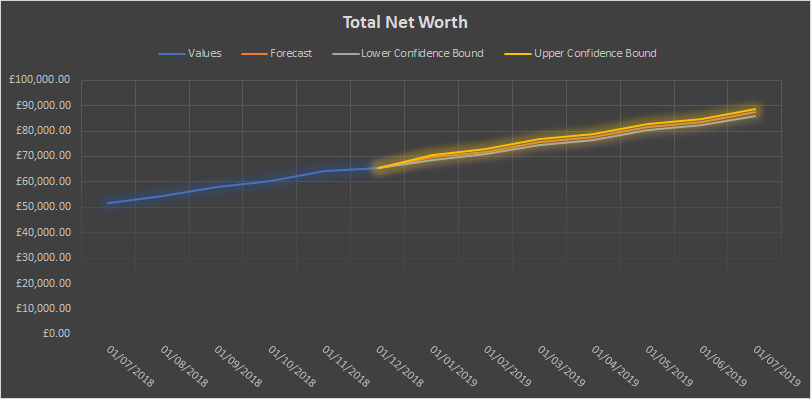
2. ISA Pot
3. Pension Pot
4. Investments Excluding House Equity
A Note on Google Sheets
The Google Sheet that you will have access to is the actual one that I will be updating each month. As I will be inputting new data online instead of uploading the Excel file each month, there are no longer file ‘versions,’ it will always be up to date.
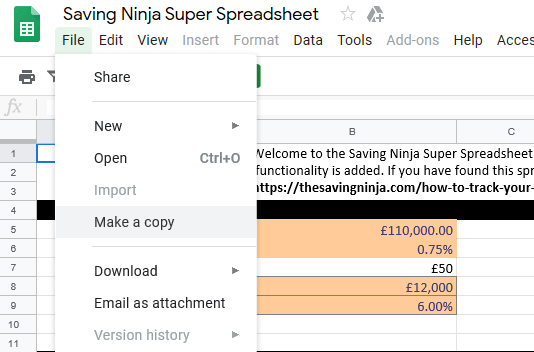
This version is ‘View Only,’ to take a copy of the sheet for your own data, you must be logged into a Google Account and click on the ‘Make a copy’ option. This copied sheet will then save into your Google Drive where you can edit the inputs and use the calculators.
The Google Sheets use App Script to run the calculators integrated into the spreadsheet. When you click on a ‘calculate’ button for the first time, you will have to grant the script permission to run inside your Google Sheet. You will also see a ‘suspicious app’ warning pop up to warn you that the scripts will have the ability to edit your sheet data.
I’ll be using this spreadsheet each month to update my savings and to help me share with you guys how much my savings have grown. I am adding features monthly and now with Google Sheets integration, you’ll get access to new features as soon as they’re developed.
Each year, a new tab will be created and the previous years’ analytics added to the ‘Analytics’ tab. You can also duplicate the ‘Savings - Blank’ tab if you want to quickly start a fresh set of data with your own inputs.
The Google and Excel spreadsheets (along with lots of other content) are available on the Secret Ninja Page which all Saving Ninja subscribers have access to. I’ll also be starting a subscriber-only newsletter in 2020.
If you’re not a subscriber yet; you can find the subscription box in the top, right-hand widget panel. It’s free, and you can always unsubscribe if you don’t want to keep in touch.
I’ll be using this page as a landing page for any special requests or questions regarding this spreadsheet. If you have any feedback or even if you’ve found it helpful, please do leave a comment below; I’d love to hear from you!